|
|||||||||
 |
|||||||||
|
(For Bulkley
Valley Trail maps, click here.) Visit my blog at
The
Wandering Cartographer
|
|||||||||
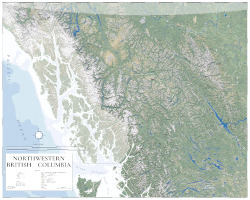 |
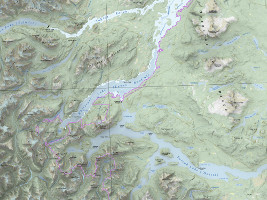
When I first moved to Smithers I was working for the National Outdoor Leadership School, and we were able to buy excellent large-format wall maps of British Columbia. If I remember correctly, six sheets covered the province (each sheet was about three by four feet), and you could mosaic these together on the wall. They were excellent for planning ... |
||||||||
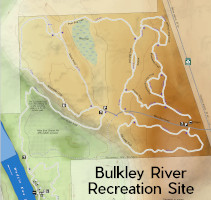
The Bulkley River Recreation Site contains aspen-forest lowlands along the river—but reached by an old dirt road that winds down off the bluff. |
 |
||||||||
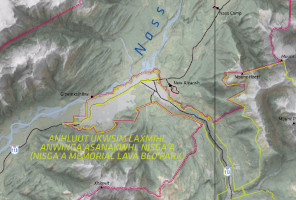 |
BC Parks requested a map of the Nass Area (which is more or less the Nass River watershed in northwest BC). This colossal seven-foot-tall tall map was to be exhibited at ... |
||||||||
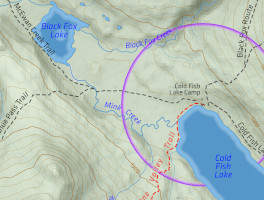
Most visitors enter Spatsizi Provincial Park by flying into Coldfish Lake. BC Parks needed signage for a number of trails that radiate from the Coldfish Lake Camp... |
 |
||||||||
 |
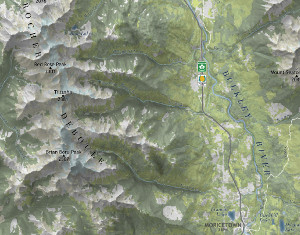
This is a backcountry ski map of the East Boulder Creek area, near Witset, BC. I made it ... |
||||||||
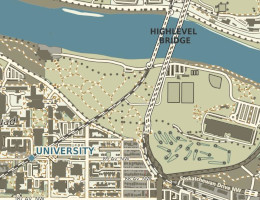
OpenStreetMap data is an amazing resource when you want to map urban areas at very large scales. In this case, my goal was to make a map someone could navigate around Edmonton, Alberta with. However... |
 |
||||||||
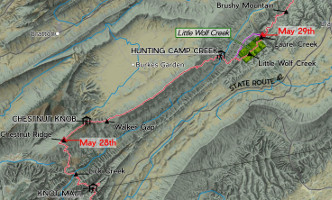 |
It turns out that the Appalachian Trail of 1982 was somewhat different from the Appalachian Trail of today, many relocations having occurred in the long, patient project of getting the trail fully located on public lands. In 1982 I hiked... |
||||||||
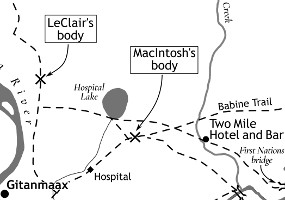
After his successful biography of Dr. Horace Wrinch founder of the hospital in Hazelton BC, Geoff Mynett followed up with a second history, one which grew out of the research he had done for the first. This was Pinkerton's and the Hunt for Simon Gunanoot,... |
 |
||||||||
 |
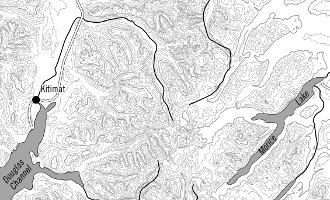
In 1952, ALCAN (the Aluminum Company of Canada) built an ambitious series of dams in order to supply its smelter in the coastal town of Kitimat, BC with the large amounts of electricity necessary to make aluminum. The plan involved damming an inland river... |
||||||||
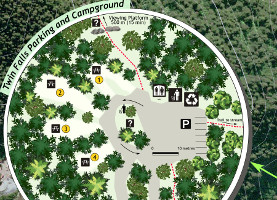
Twin Falls is the premier outdoor
site to which Smithers visitors are taken, so it was an honour
to be asked by Recreation Sites and Trails BC to prepare a new
map for it.. |
 |
||||||||
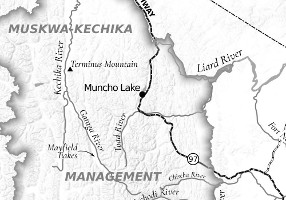 |
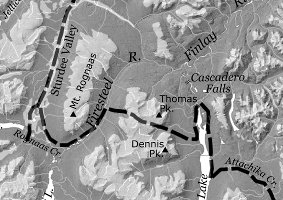
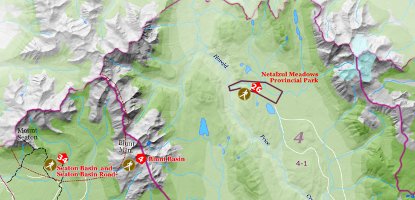
I did three maps for Wayne Sawchuk's autobiography, Crossing the Divide: Discovering a Wilderness Ethic in Canada’s Northern Rockies, published by Creekstone Press in 2020. Much of his story centres around the Muskwa-Kechika Management Area in northeastern British Columbia... |
||||||||
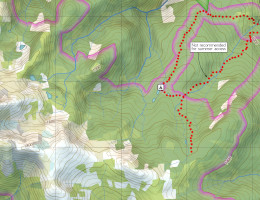
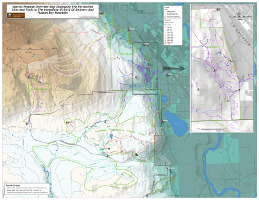
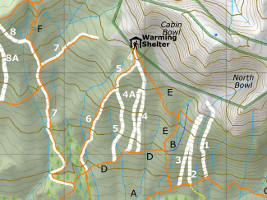
Recreation Sites and Trails BC was
looking for a map that would show all of the trails just outside
Smithers that have been developed in the past twenty years.... |
 |
||||||||
 |
There is a motocross area near the Terrace airport called
Sandur; this will be the map at the entrance... |
||||||||
In the summer, the Onion Lake
Nordic Ski area in Kitimat hosts the Clearwater Lakes trail... |
|
||||||||
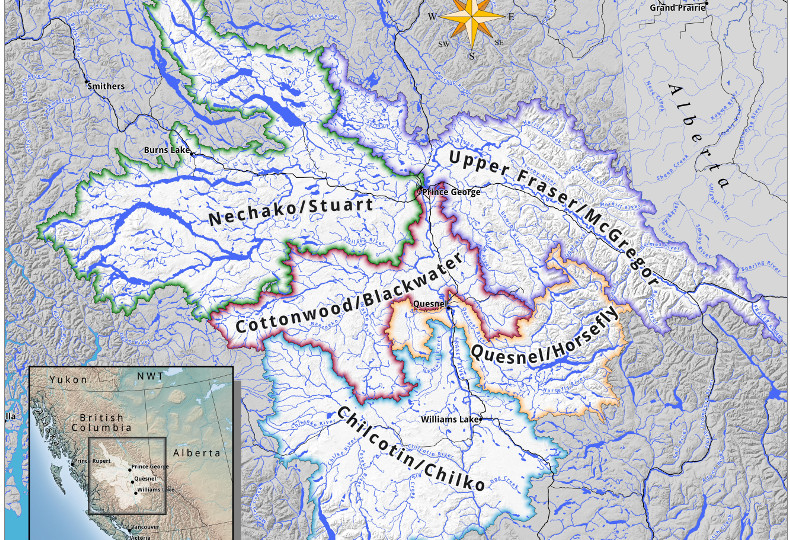 |
The Upper Fraser Fisheries Conservation Alliance works for the
conservation and sustainable harvest of fish by its member
communities, which are ... |
||||||||
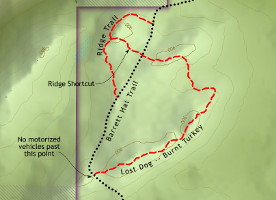
This will be the new trailhead map
for the area around Barrett Hat, just south of Smithers,... |
 |
||||||||
 |
In 2018 Creekstone Press released
Tyler McCreary's Shared Histories, an account of
indigenous-settler relations in and around Smithers. I did four
maps... |
||||||||
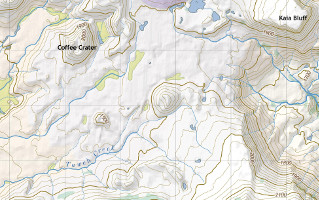
A friend planning to hike in BC's
spectacular Mt. Edziza Provincial Park asked me to develop some
useful and easily printed maps of the park. This new 1:35,000
scale series covers... |
 |
||||||||
 |
This is a map of a backcountry skin-up-and-ski-down site near
Smithers, managed by the Bulkley Backcountry Ski Society. |
||||||||
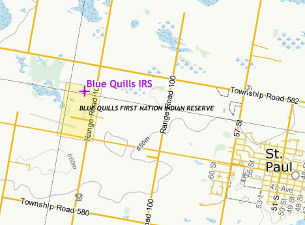
This is one of the most interesting
yet disturbing projects that I've done. I was hired in the
spring of 2017 to map the 140 Indian Residential Schools and
their surrounding Reserves. ... |
|||||||||
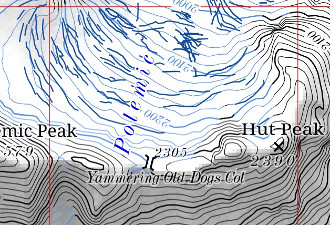 |
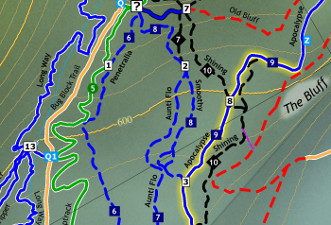
This is a backcountry ski guide's map, to be used in
route-finding with clients from the Burnie
Glacier Chalet. It shows the central section of the Howson
Range ... |
||||||||
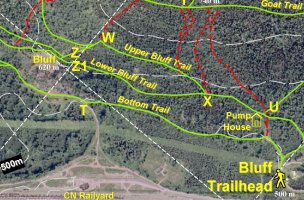
Ten years ago, when I was still
working with MapInfo, I made some maps to be displayed on kiosks
at the major trailheads near Smithers. This year I got to
re-make them ... |
|||||||||
 |
In 2016, Creekstone Press published Neil Sterritt's history of
Hazelton and Gitanmaax, Mapping
My Way Home. I was asked to do eleven maps for the
book, and... |
||||||||
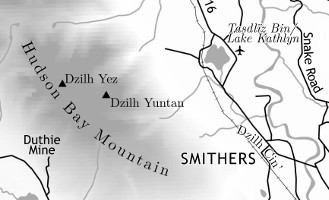
After living in the Bulkley Valley
of northern BC for 20 years, I felt like we needed a local map -
both for travellers who visit and for local people seeking to
explore. This seemed like an ideal opportunity, as well, to
experiment further with using ... |
|
||||||||
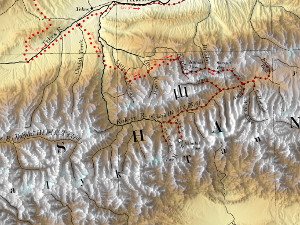 |
Famous as the leader of Britain's 1921 Mt. Everset Reconnaisance Expedition, Charles Howard-Bury made what may be a more interesting journey in 1913, to the Tian Shan Mountains in China's Xinjiang province... |
||||||||
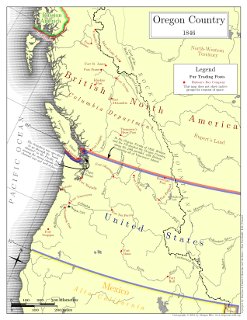
The Museum
in Osoyoos, BC, commissioned a series of 11 maps showing
the evolution of the Oregon Country from 1792 to 1872. Many of
these were for an online
exhibit on the War of 1812 in the West... |
 |
||||||||
 |
In 1979 Joyce Helweg's husband took her on a 40-day horsepacking trip. In 2012 she published the story as A Change In Direction. |
||||||||
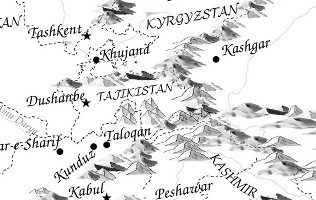
For his book Is
This Your First War?
Maclean's correspondent Michael Petrou needed a map of
all the places he had visited in Central Asia... |
 |
||||||||
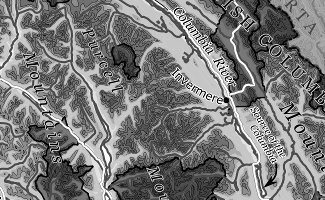 |
Two maps of the Columbia River Basin (as it was in 1800, and in 2012) for a publication of the Kelowna Art Gallery to go along with their exhibit of watercolours by John Hartman. |
||||||||
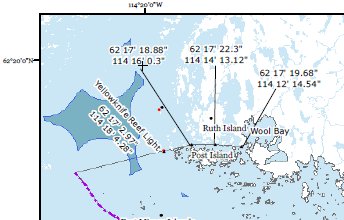
The Canadian Coast Guard can
designate certain areas as Sheltered Waters, which in
turn simplifies the licensing requirements for guiding in those
waters. In this set of maps for the Northwest Territories, I
mapped zones that were more than one nautical mile, and more
than five nautical miles, offshore. |
|
||||||||
 |
This is a tiny piece of a giant map. Commissioned by the Driftwood Foundation for the 4000 Voices Festival, it showed every stream crossing in northern BC that the proposed Northern Gateway Pipeline would make. The map was in total thirteen-and-a-half feet long, and just over two feet high. |
||||||||
This is a long thin map of the
terrain through which the proposed 1,177 km Northern Gateway
pipeline would pass. Clips from the map were used as background
on chapter pages in The Enpipe Line, a collection of
poetry published by Creekstone Press in March 2012. |
 |
||||||||
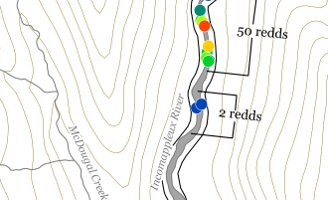 |
A fisheries biologist walks a river looking for the redds (or spawning beds) of bull trout, and then files a report on what was found. These maps were prepared as figures for one such report, which concerned bull trout in creeks flowing into the Upper Arrow Lakes reservoir near Revelstoke, BC. |
||||||||
The Bulkley Valley Community
Resources Board periodically convenes meetings to discuss
local agreements over which areas of the backcountry permit
motorized access. These maps were made to familiarize table
members with all the areas under discussion. |
 |
||||||||
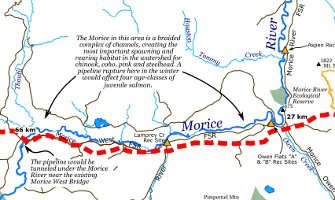 |
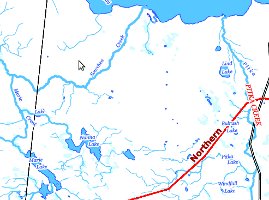
This map was created to help raise awareness among anglers
about the threats to BC's Morice and Bulkley rivers from the
proposed Enbridge Northern Gateway pipeline. (The Morice and the
Bulkley are actually the same river, differently named in
different reaches) This work was for the Friends
of Morice-Bulkley. |
||||||||
|
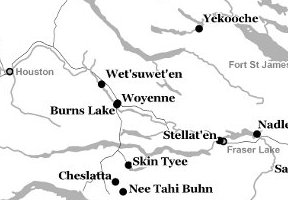
This black-and-white map, for a journal article, locates thirteen First Nations communities within the Carrier-Sekani Tribal Council in central British Columbia.
|
|
||||||||
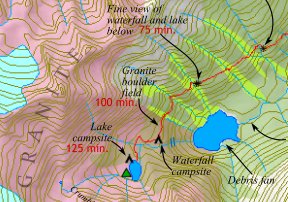 |
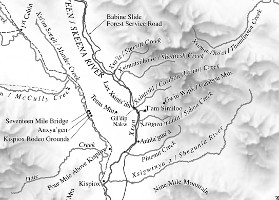
This is a detail from a series of trail maps I have
made for the Bulkley Valley. The data is a combination of free vector data from
the province of BC's GeoBC
website and the federal government's CanVec
FTP site, WMS
images
availae through GeoBC, and GPS tracks I've recorded. It is displayed in Quantum GIS running under Ubuntu
linux, and finished off with Inkscape running under Windows. |
||||||||
|
By re-processing exsting, public-domain data, I produced a series of "VNC-like" 1:250K topos for the civilian air search-and-rescue group in Smithers, BC, (CASARA) to use as navigation maps. These combine the NTS 1:250K topographic base with the shaded relief and hypsometric tinting found on the 1:500K Visual Navigation Charts used by pilots. |
|
||||||||
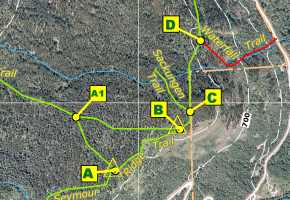 |
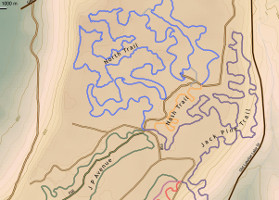
This is a detail of a trails map for the Community Forest just outside Smithers, British Columbia. These trails interconnect at several points with the Northeast Slope Trails (see below). Labels indicate letter signs posted at trail intersections |
||||||||
|
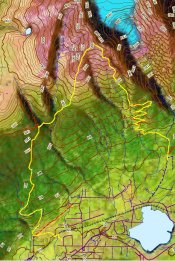
This is a detail of a trails map of the northeast slope of Hudson Bay Mountain, at the edge of town in Smithers, British Columbia. The bottom layer in this map is a 1 metre orthophoto mosaic produced for the BC Forest Service. The chief challenge in the map was selecting colours that would show up well against this background of various values and hues. |
|
||||||||
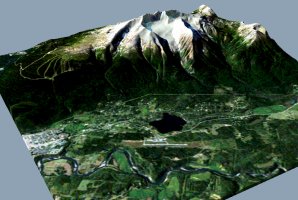 |
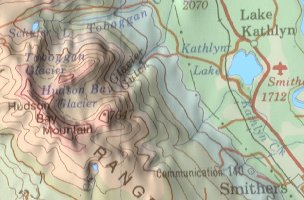
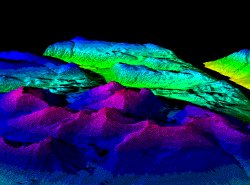
This image shows Hudson Bay Mountain, in British Columbia, and the valley on its southeast side. I created this 3D scene using 3DEM, one of the best pieces of presentation software for digital elevation models (DEMs). The DEM data was from CDED (Canadian Digital Elevation Data) available free from geobase.ca, and the orthorectified satellite image came from toporama.ca. |
||||||||
|
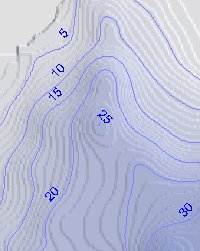
These bathymetry contours, overlaid on a shaded image of a lake bottom, were generated from a set of spot depths. I used GRASS to interpolate a surface from the spot depths, and then to generate contours from that surface. I produced the background image using 3DEM, and displayed the contours over it using dlgv32pro. For a lake outline I used Lake Kathlyn, British Columbia. The spot depths were fictitious. |
 |
||||||||
 |
The image at left shows a portion of Hudson Bay Mountain, British Columbia. I made it with the Autodesk MapGuide browser plug-in, which is essentially just a viewer for on-line data. In this case the data is from the British Columbia Ministry of Energy and Mines online multi-layer geographic database. The data displayed here is from their on-line BCGS Geology Map. |
||||||||
|
The image at right shows a portion of the Northwest Territories—a small slice of NTS Quad 76D. The 3D view was generated by MicroDEM, a piece of software that is specifically geared to displaying digital elevation model data. The DEM data came from CDED at geobase.ca, and the topographic raster overlay came from toporama.ca. |
 |
||||||||
 |
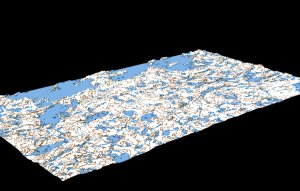
The image at left shows the Pacific Northwest Coast "turned on its head," so that it appears to run parallel to the top of the mapsheet I made this map with gmt (the generic mapping tools), an open-source mapping package whose pscoast application is particularly well suited to displaying coastlines, and offers a huge number of projections. I used the high resolution coastline database that comes with gmt. |
||||||||
|
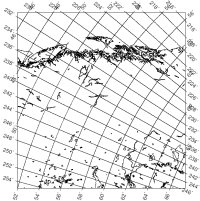
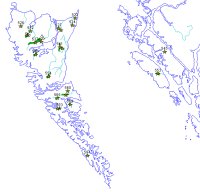
The image at right shows the Queen Charlotte Islands and the adjacent coast of British Columbia. It was done with MapInfo. Like ESRI's ArcView, MapInfo is geared to displaying geographic features that are associated with tables of data. The data here are the drainages layers (15, 16 & 17) of the BC portion of the National Atlas of Canada, 1:2,000,000, from geogratis.ca. |
 |
||||||||
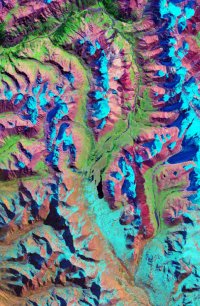 |
This is an image of the Tien Shan Mountains in Kyrgyzstan, Central Asia. I used GeoExpresss View to extract this small image from a MrSID file. GeoExpress View is the free MrSID viewer from Lizard Tech, and has elegant tools I have seen for zooming and panning in MrSID images. It also allows you to save any subportion of the image as a GeoTiff file. The data is from NASA's Geo Cover product, downloaded from the NASA Earth Science Applications Directorate. |
||||||||
|
This is a 3D rendering of part of the Ark Mountain 1:50,000 quadrangle, Yukon Territory, Canada. I created it by taking vector hypsography data and converting into a digital elevation model using GRASS. GRASS's command-line interface makes it easy to chain together multiple commands into a tool you've never seen before. The data came from Canada's National Topographic Database product, from the Centre for Topographic Information, Sherbrooke. |
 |
||||||||
|
For cartography, please contact Morgan at
mjh[at]hesperus-wild.org.
|
|||||||||